Recently I was testing and comparing cloud functions services. For this purpose the JMeter was chosen to provide simple single endpoint test. Today I’d like to share the whole process with you. It’s really easy, so let’s go through it.
In this short tutorial you’ll learn how to use JMeter to run simple performance test for single web service endpoint (or a website) using HTTP/HTTPS requests and generate the test report.
Installation
Unfortunately I didn’t find JMeter in my Linux repositories to provide single-command installation. So we’ll quickly go through installation process on Linux machine. In my case it is Fedora.
JMeter requires Java to run properly so we can start from JDK installation.
Download and unzip the latest JMeter package.
Optionally you can create a symbolic link.
Okay, let’s cd to the proper folder and run the JMeter.
Preparing test
Add a Thread
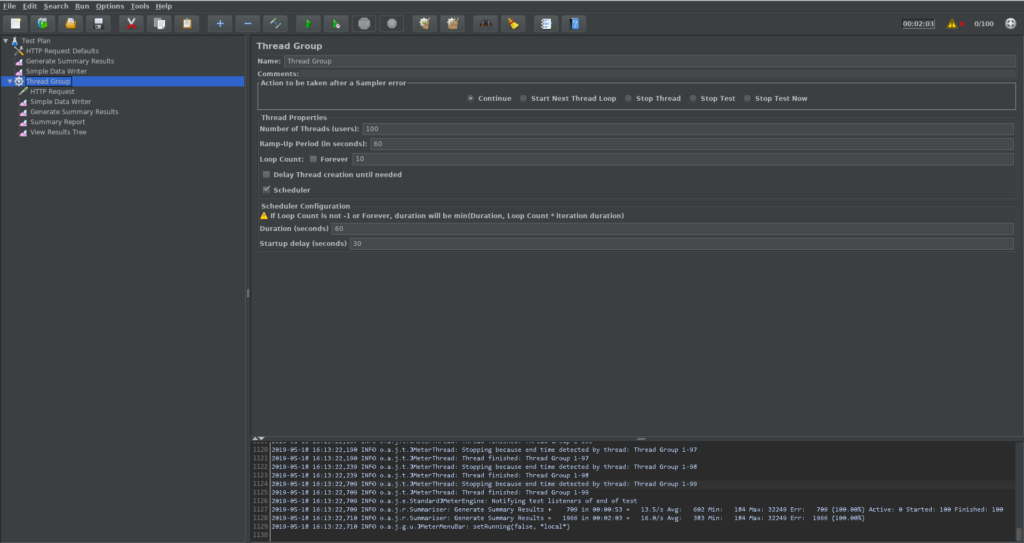
First of all you have to provide a Thread. It contains information about threads which are simulation of users traffic (one thread per one user).
Right click on Test Plan, then Add -> Threads/Users -> Thread Group.
Add HTTP requests sampler
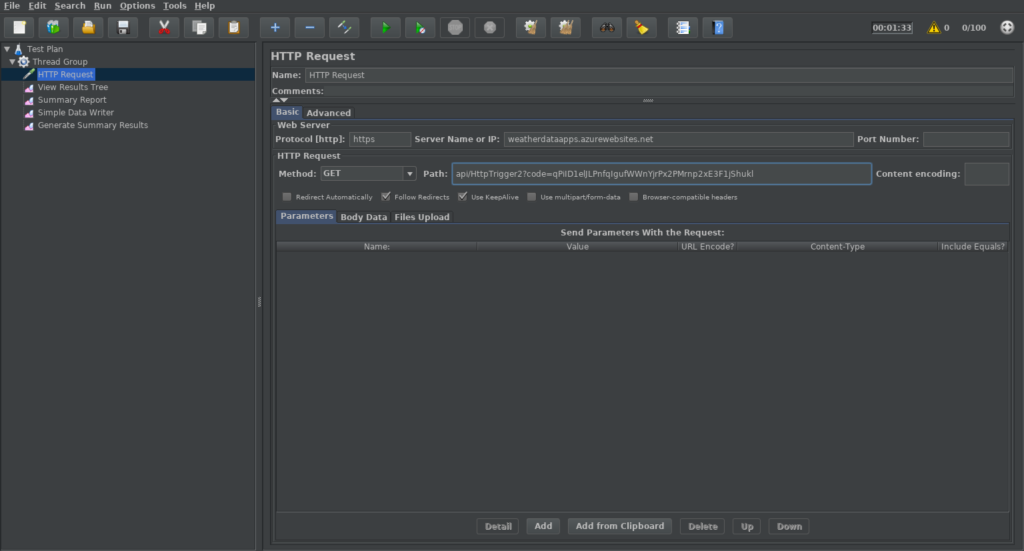
We need something to send HTTP/HTTPS requests. In JMeter we have so-called samplers and it’s time to add one.
Right click on Thread Group, then Add -> Sampler -> HTTP Request
Add listeners
Now we have to catch our requests and responses and process them in a proper way.
Right click on Thread Group, then Add -> Listener -> Simple Data Writer
In the same way you should add Generate Summary Results, Summary Report and View Results Tree. The latter two are optional and their purpose is to provide more convenient way of monitoring the test process.
Configuration
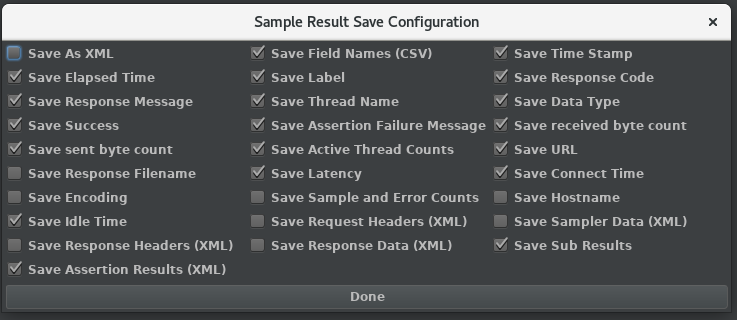
Now you should provide proper path in Simple Data Writer. Provide absolute path, something like this:
Don’t worry if file doesn’t exists at the moment. JMeter will create it on demand.
Check if Save as XML option in Configuration window is disabled.
Let’s go back to the HTTP Request window. Here you can specify your endpoint path (in similar way like you do it in HTTP request headers). If you need HTTPS connection you can write https in a Protocol field.
It’s time to specify desired traffic level. Go to Thread Group window and configure it yourself. The most important parameter here is obviously Number of Threads (users).
Run your test
Press the green button Start in order to run your test.
During the test you can monitor the Summary Report and View Results Tree tabs to get more information about the test progress.
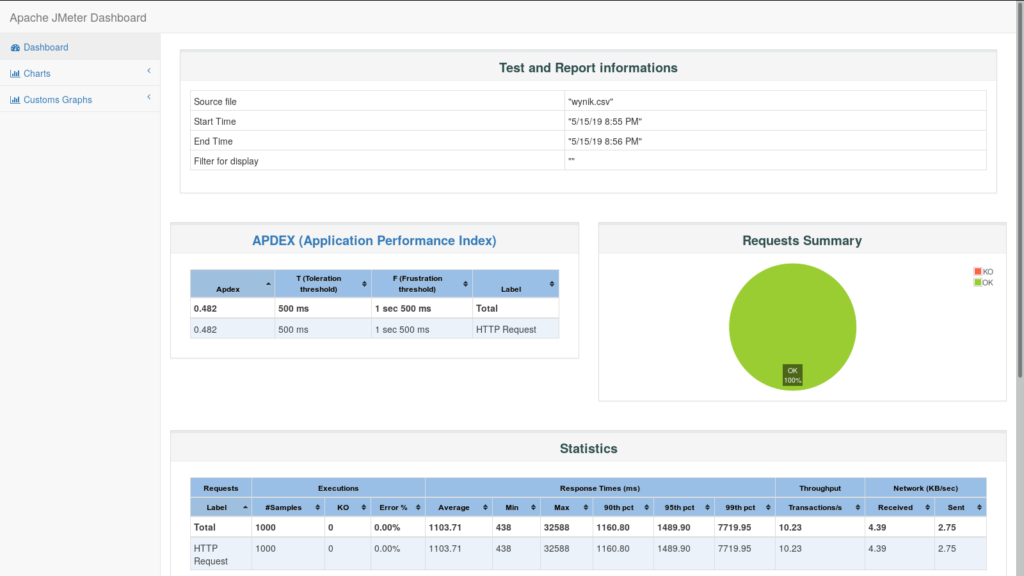
Generating report
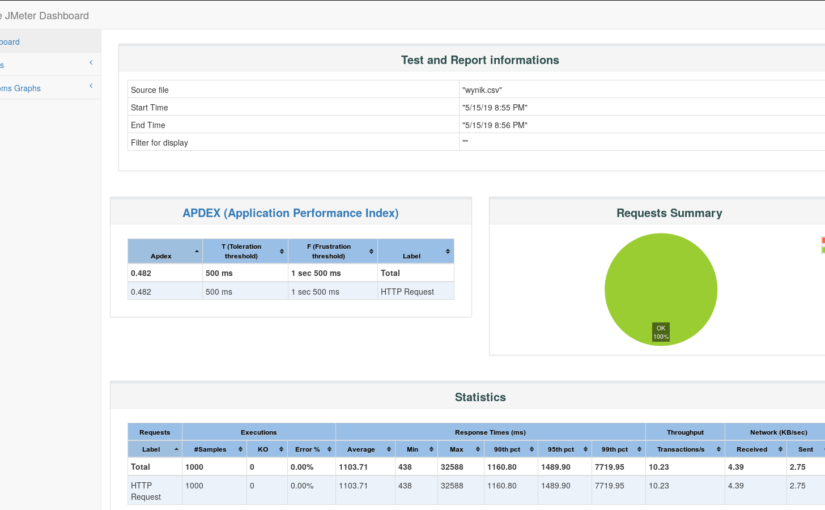
If your test went well and CSV results file was generated successfully it’s time to generate the report.
The report will provide you, among others:
- Apdex (application performance and user satisfaction index) score
- Min, max and average response times
- Multiple charts with over time/throughput/response time data
The report itself it’s a HTML file with interactive charts and information about the test performance and results.
In order to generate it go to JMeter home directory and run following command:
Where result.csv is your test results file and result-reports is a destination folder for the report (you need mkdir it before or provide full absolute path with destination folder).
If it’s all okay you should browse to the destination folder and run index.html file in your browser.
Summary
And that’s it. For more specific reports and more advanced tests you can use cloud solutions which are using JMeter at scale using cloud services to run tests.
Good luck!